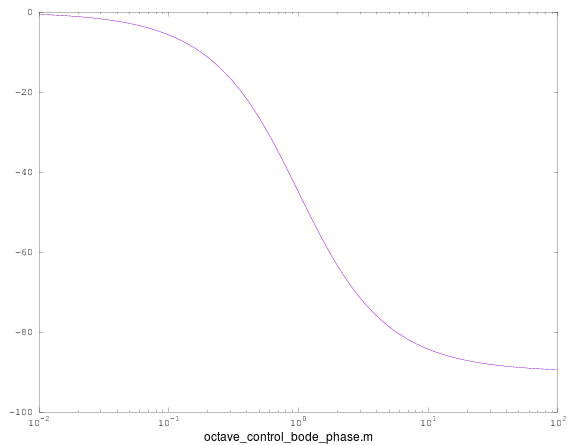
Function: octave_control_bode_phase ( num, den, min, max, n )
-
A Bode plot is a graph of the transfer function of a linear, time-invariant system versus frequency, plotted with a log-frequency axis, to show the system's frequency response.
function out=octave_control_bode_phase( num, den, min, max, n )
 w = logspace( min, max, n  )
 s = polyval(num, complex(0, w))./polyval(den, complex(0, w));
 phase = angle(s)/3.14159*180;
 semilogx(w, phase);
 out = "";
endfunction
Function: [mag, pha, w] = bode ( sys )
Function: [mag, pha, w] = bode ( sys, w )
-
Bode diagram of frequency response.
-
See Also ...
- octave_control_nyquist.m
