Function: octave_control_nyquist ( num, den, min, max, n )
-
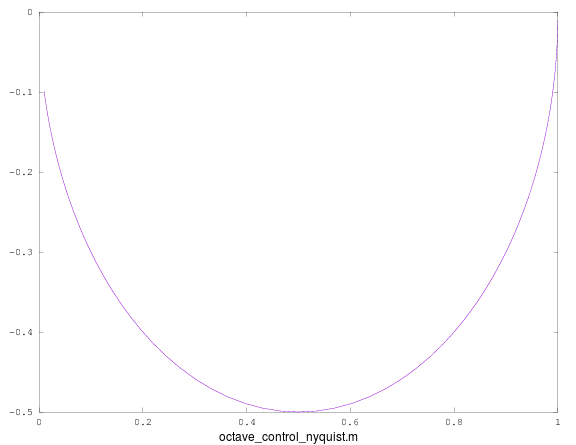
A Nyquist plot is a parametric plot of a transfer function.
function out=octave_control_nyquist( num, den, min, max, n )
 w = logspace( min, max, n  );
 s = polyval(num, complex(0, w))./polyval(den, complex(0, w));
 plot( real(s), imag(s) )
 out = "";
endfunction
>function g=G(s)
>g = 1./(1+s);
>endfunction

> w = logspace( -2, 1, 100  );
> s = G(j.*w);

> plot( real(s), imag(s) )
Function: [re, im, w] = nyquist ( sys )
Function: [re, im, w] = nyquist ( sys, w )
-
Nyquist diagram of frequency response.